--group by 와 pivot table 의 차이점
----다차원(multi-demention)에서 작동
----data가 있을 때 어떤 기준으로 나누고 각 그룹의 수치의 값을 볼지 결정한다
** Titanic 의 생존자 data를 seaborn 에서 가져와서 실습해보자**
1. seaborn 에서 titanic 생존자 data를 가져오기
2. 성(sex)별생존자 를 계산한다
3. 선실별 등급(class) 과 성별의 생존률의 관계
4. 0,24,60의 나이대 그룹에서 생존 성별,등급
5. 0,24,60 의 나이대 그룹에서의 생존 성별 등급의 평균 좌석별 요금(fare)
6. 생존자의 총합, 요금의 평균값을 생성
seaborn 에서 titanic 생존자 data를 가져오기
import numpy as np
import pandas as pd
import seaborn as sns
import matplotlib.pyplot as plt
plt.style.use('seaborn')
titanic = sns.load_dataset('titanic',engine='python')
titanic

성(sex)별생존자 를 계산한다
titanic.groupby('sex')[['survived']].mean()

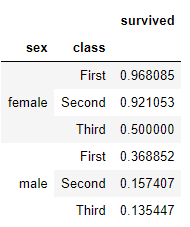
선실별 등급(class) 과 성별의 생존률의 관계
titanic.groupby(['sex','class'])[['survived']].mean()
---row base로 옆으로 펼친다

titanic.pivot_table('survived', index='sex', columns='class')

--3개의 그룹상황에서의 pivoting
age_div = pd.cut(titanic['age'],[0,24,60])
--원하는 나이 구간을 위해 생성한다
titanic.pivot_table('survived',['sex','age'],'class')
--age라는 column으로만 pivoting 할 때 상황

--위에서 선언한 age_div를 이용해 구간을 적용함

--2개의 multi group 이 필요함
age_div = pd.cut(titanic['age'],[0,24,60])
fare_div = pd.qcut(titanic['fare'],2)
titanic.pivot_table('survived',['sex',age_div],['class',fare_div])

titanic.pivot_table(index='sex',columns='class',aggfunc={'survived':sum,'fare':np.mean})

댓글 없음:
댓글 쓰기