본론
2-1-10 ggplot2 패키지
ggplot2 패키지의 활용 예제
> install.packages("ggplot2")
jumsu <- read.table("student_korean_score.txt",header=T,sep="")
> jumsu
이름 과목 점수
1 이효우 국어 90
2 양덕유 국어 70
3 박민정 국어 92
4 장동희 국어 76
5 이천균 국어 97
6 홍진관 국어 80
7 최보희 국어 20
8 윤정웅 국어 50
9 주인혜 국어 60
>
ggplot(jumsu,aes(x=이름,y=점수)) + geom_point()
savePlot("2-1-10.png",type="png")
ggplot(data.aes(x=x축 데이터 , y=y출 데이터)) + geom 함수
ggplot(jumsu,aes(x=이름,y=점수)) + geom_bar(stat="identity")
savePlot("2-1-11.png",type="png")
-->기존 점과는 다르게 막대로 표시
ggplot(jumsu,aes(x=이름,y=점수)) + geom_bar(stat="identity",fill="cyan",color="red")
savePlot("2-1-12.png",type="png")
-->막대그래프와 테두리 색상 입히기
gb <- ggplot(jumsu,aes(x=이름,y=점수)) + geom_bar(stat="identity",fill="cyan",color="red")
gb + theme(axis.text.x=element_text(angle=45,hjust=1,vjust=1,color="blue",size=10))
-->angle 함수로 x축 항목을 기울인다
savePlot("2-1-13.png",type="png")
student_info_kem.csv 를 이용함
kem <- read.csv("student_info_kem.csv",header=T,sep=",")
-->과목별로 구분되어있음 , 이름으로 구분지어야함
lab <- arrange(kem,이름,과목)
lab <- ddply(lab,"이름",transform,합계=cumsum(점수))
> lab
이름 과목 점수 합계
1 박민정 국어 92 92
2 박민정 수학 76 168
3 박민정 영어 95 263
-->합계점수가 없으면 위치 선정이 어렵기때문에 생성한것
-->ddply 함수로 plyr패키지안의 함수로 데이터 프레임형태로 저장해주는 함수
lab <- ddply(lab,"이름",transform,합계=cumsum(점수)-0.5*점수)
> lab
이름 과목 점수 합계
1 박민정 국어 92 46.0
2 박민정 수학 76 130.0
3 박민정 영어 95 21
-->수치를 그래프에 표시하기위한 위치를 계산하기
gb2 <- ggplot(lab,aes(x=이름,y=점수,fill=과목)) + geom_bar(stat="identity") + guides(fill=guide_legend(reverse=TRUE)) +
##geom_text(aes(y=label,label=paste(점수,"점")),color="black",size=4)
-->왜안되지
gb2 + theme(axis.text.x=element_text(angle=45,hjust=1,vjust=1,color="black",size=10))
savePlot("2-1-14.png",type="png")
2-1-11 geom_segment() 함수
student_info_txt.txt 이용
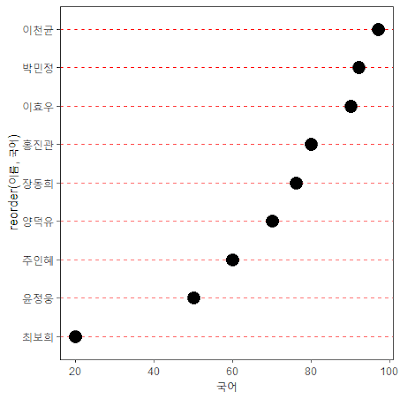
-->cleveland dot plot 을 만들어주는 함수
-->cleveland.png 참조
data <- read.table("student_info_txt.txt",header=T,sep=",")
data[,c("이름","국어")]
ggplot (data,aes(x=국어,y=reorder(이름,국어))) + geom_point(size=5) + theme_bw() + theme(panel.grid.major.x=element_blank(),panel.grid.minor.x=element_blank(),panel.grid.major.y=element_line(color="red",linetype="dashed"))
savePlot("2-1-15.png",type="png")
ggplot(data,aes(x=국어,y=reorder(이름,국어))) + geom_segment(aes(yend=이름),xend=0,color="red") + geom_point(size=5)+ theme_bw() + theme(panel.grid.major.x=element_blank(),panel.grid.minor.x=element_blank(),panel.grid.major.y=element_blank())
savePlot("2-1-16.png",type="png")
2-1-12 geom_line()함수
3_student_point.csv 파일을 이용함
data2 <- read.csv("3_student_point.csv",header=T)
> data2
이름 과목 점수
1 이효우 국어 90
2 양덕유 국어 70
3 박민정 국어 92
4 이효우 영어 85
5 양덕유 영어 65
data2 <- arrange(data2,이름,과목)
ggplot(data2,aes(x=과목,y=점수,color=이름,group=이름)) + geom_line()
savePlot("2-1-17.png",type="png")
ggplot(data2,aes(x=과목,y=점수,color=이름,group=이름)) + geom_line() + geom_point()
savePlot("2-1-18.png",type="png")
-->점수에 점이 찍히는 그래프 형상
ggplot(data2,aes(x=과목,y=점수,color=이름,group=이름,fill=이름)) + geom_line() + geom_point(size=5,shape=22)
savePlot("2-1-19.png",type="png")
-->점수부분에 사각형 점을찍음
2-1-13 저수준 작도 함수
기존에 그려진 그래프에 선이나 설명을 집어넣음
plot(1:10)
abline(h=5)
rect(1,6,4,9)
arrows(1,1,4,4)
text(8,9,"Test")
title("Here is Main","Here is Sub")
legend(8,3,lty=1:3,c("p","q","r"))
savePlot("2-1-20.png",type="png")
4분면 graph 작도
plot(rnorm(100),rnorm(100),xlim=c(-5,5),ylim=c(-5,5),axes=F,ana=F)
axis(1,pos=0,at=-5:5,adj=0,col=2)
axis(2,pos=0,at=-5:5,adj=0,col=3,las=2)
box()
savePlot("2-1-21.png",type="png")


댓글 없음:
댓글 쓰기